
Visual Studio is Microsoft’s all-in-one integrated development environment, long hailed as the “number one IDE in the universe.” It bundles code editing, project management, build, debugging, testing, performance profiling, and deployment into one package, and it’s been a core tool for C#, .NET, C++, desktop, and enterprise development for years. Compared with lightweight editors that mostly just edit code, Visual Studio leans into full engineering capability, and its edge shows most clearly in debugging, diagnostics, and large-project collaboration.
If the essence of debugging is restoring explainability once a system’s behavior drifts from what you expected, then the value of the Visual Studio debugger lies precisely in how fine-grained and systematic it makes the job of observing runtime facts. You don’t just see whether a line of code ran; you see which call path got it there, what state the variables were in, where an exception was thrown, at which iteration a condition first went sideways, and even whether you’re looking at a logic problem, a concurrency problem, or a performance problem.
This piece isn’t trying to repeat the feature list the official docs already cover systematically. Instead, it’s a deliberately selective tour of the Visual Studio debugging capabilities most worth mastering, written from the angle of real development and troubleshooting. Rather than listing every feature, what I care about is which capabilities actually get used in real projects, where people most often trip up, and the debugging judgment and experience developers need to build beyond what the official docs say.
Learning Resources for Visual Studio Debugging
When it comes to learning resources, the official docs are unquestionably the best, and there’s no point rehashing them here.
- The debugger docs homepage (the sidebar alone tells you how deep VS’s debugging features go): Debugger documentation – Visual Studio (Windows) | Microsoft Learn
- Using C++ as an example, if you want a sense of the overall debugging flow: Tutorial: Debug C++ code – Visual Studio (Windows) | Microsoft Learn
- Development today can’t avoid AI, and the best fit is naturally Microsoft’s own GitHub Copilot: Debug with GitHub Copilot – Visual Studio (Windows) | Microsoft Learn
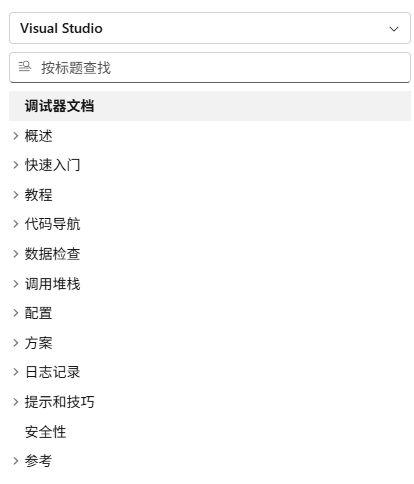
What matters most about documentation is filling gaps: first knowing a feature exists, then being able to find it when you need it.
1. First, Set the Right Expectation: Debugging Isn’t Clicking a Few Buttons, It’s Organizing Evidence
When people first learn IDE debugging, they tend to see it as a grab bag of scattered features: breakpoints, stepping, watching variables, resuming execution. In reality, those capabilities only make sense once they’re slotted into a clear troubleshooting workflow. A solid debugging path usually looks like this:
- Reproduce the problem first, confirm it’s real, and get it to trigger as reliably as possible.
- Decide where to observe from — a breakpoint, an exception break, a log point, or attaching to a running process.
- Observe the runtime evidence: variables, the call stack, thread state, and exception details.
- Form a hypothesis from the evidence, then design the next round of verification.
- After fixing it, re-verify that the change addressed the root cause and not just the symptom.
What makes the Visual Studio debugger strong isn’t that it thinks for you — it’s that it gives every link in that chain a better tool to work with. What follows is essentially that chain, spelled out in detail.
2. Before You Start Debugging: Get the Launch Method and Environment Straight
A lot of inefficient debugging has nothing to do with not knowing how to read variables — it’s that you weren’t observing the problem in the right environment to begin with.
1. The Difference Between F5 and Ctrl+F5
It’s the most basic distinction, and also the one most easily overlooked.
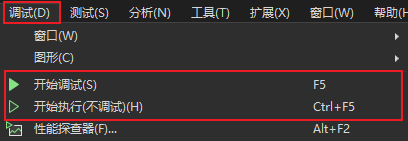
- `F5` is Start Debugging — the program runs with the debugger attached.
- `Ctrl+F5` is Start Without Debugging — good for a quick functional check, but it won’t hit breakpoints.
If you want to inspect variables, the call stack, exception details, or have the program pause at a breakpoint, you have to use `F5`.
2. Don’t Conflate Debug and Release Configurations
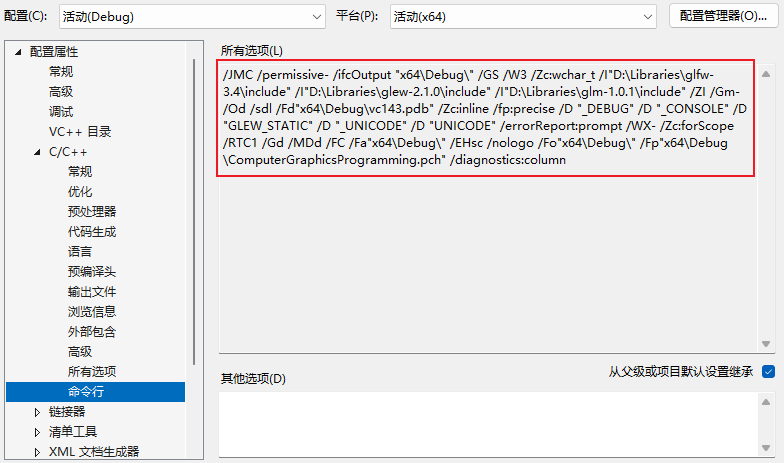
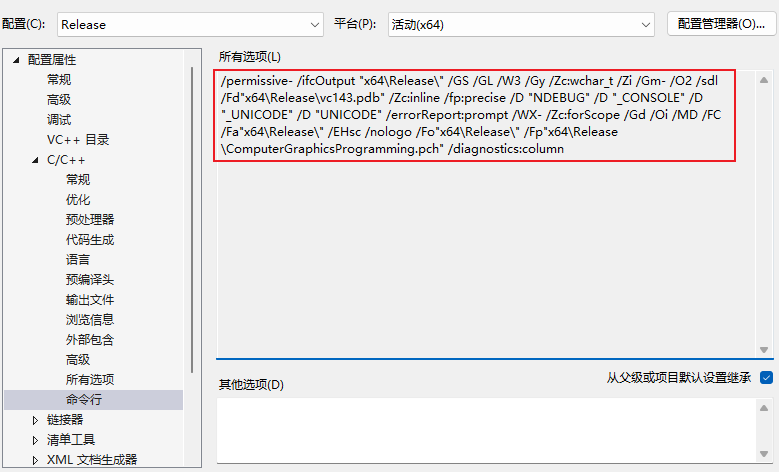
Plenty of problems are hard to track down simply because a developer can’t reproduce them in Debug and assumes production must behave the same way. In reality, Debug and Release can differ in how they compile, what optimizations they apply, and what symbol information they carry — and that can translate into different runtime behavior. The gap shows up especially clearly in these cases:
- Compiler optimizations make variables display oddly or execution order hard to follow intuitively.
- Multithreading and race conditions only surface under something closer to real load.
- Edge-case behavior that only triggers under a Release configuration.
So before you start digging, ask yourself: is the configuration and launch method I’m debugging actually the one where the problem really happens? If not, the deeper you look, the more skewed your conclusions can get.
Note: Debug and Release are, at bottom, two different sets of compiler arguments — their goals, optimization strategies, and build output all differ substantially. This isn’t a difference of one or two flags; it’s a whole configuration set designed for a different purpose.
3. Launch Arguments, Environment Variables, and the Startup Project Are Part of Your Debugging Context Too
For many project types in Visual Studio, you can configure all of this in the project properties or launch settings:
- Command-line arguments
- Working directory
- Environment variables
- Launching a browser or a specific URL
- Multi-project startup
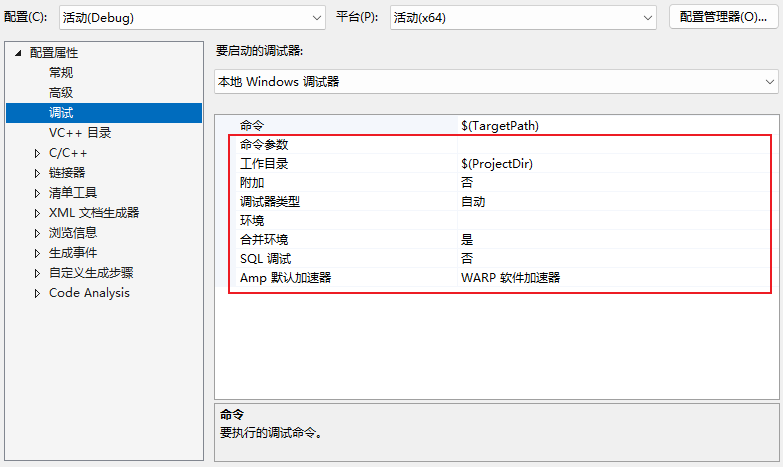
This kind of configuration gets overlooked easily, but it often decides outright why you can’t reproduce something that reproduces fine for someone else. If the problem has anything to do with input, configuration, paths, network addresses, ports, or account permissions, you need to line up this launch context first.
4. Restart Beats Stop-Then-Relaunch
Plenty of developers, the moment they change a condition, reflexively hit Stop and then F5 again. Visual Studio’s Restart saves you that round trip, and the savings are especially noticeable for applications with a costly startup. It doesn’t change your troubleshooting logic, but it cuts the friction of repeated verification considerably.
3. Breakpoints: Debugging’s Most Basic, and Most Underrated, Capability
A breakpoint isn’t just about stopping a program. Its real purpose is putting your observation at the right place.
1. Plain Breakpoints: Answer “Did the Code Even Get Here” First
This is the most basic use, and one of the first things worth confirming when you troubleshoot. A lot of bugs look like “something’s wrong with this line,” when the real issue is that the line never ran at all.
Typical cases where a plain breakpoint fits:
– You suspect a branch was never entered.
– You suspect a method was never called at all.
– You want to confirm whether the state was already broken before execution reached some key point.
If you’re not even sure the code reaches this point, don’t rush to guess at logic — stop the program first.
2. Conditional Breakpoints: When a Problem Only Happens Under a Specific State
Conditional breakpoints are one of the features in Visual Studio most worth mastering. Their core value: instead of stopping every time execution reaches this point, they stop only when a specified condition holds.
Typical cases include:
- A bug only occurs when a variable equals a specific value.
- Something only goes wrong after an object’s state changes.
- You only want to pause for a particular request, thread, or branch of the flow.
In practice, conditional breakpoints keep you from getting interrupted by a flood of irrelevant pauses in loops, hot paths, or frequently called methods. If a problem only shows up “after the 500th iteration” or “when a particular user input triggers it,” a conditional breakpoint is usually far more efficient than mashing `F5` over and over.
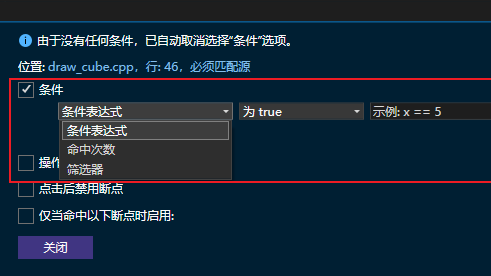
3. Hit Count: A Sharp Tool for Loop and Timing Problems
Hit count breakpoints are a great fit for problems where the first several passes look fine and then, at some point, the state starts to drift. For example:
- A loop produces the wrong result after a particular iteration.
- A message handler’s state gets corrupted after repeated calls.
- A cache, collection, or counter only breaks after accumulating state for a while.
At that point, instead of hitting Continue over and over, just let the breakpoint pause on a specific hit count.
4. Filters: Don’t Watch Every Context at Once for Multithreaded or Multi-Process Problems
Breakpoint filters let you narrow a break down to a specific process, thread, machine, or similar condition. Any time a problem has the fingerprints of concurrency, background tasks, multiple worker threads, or multiple process instances, this capability pays off.
Otherwise you’ll run into a very typical kind of debugging noise: the breakpoint does hit, just not in the execution context you actually wanted to look at.
5. Function Breakpoints: Great When You Know the Function Name but Not Its Location
In a large project, a function might be overloaded, called across files, or you might only know its name and not want to dig through every source file by hand. In that situation, a function breakpoint beats hunting for the location manually.
It’s especially useful for:
- Tracking down framework callbacks, lifecycle methods, and event handlers.
- Suspecting a shared method is getting called unusually often.
- Cases where the code location isn’t fixed, but the entry point is fairly clear.
6. Tracepoints: When You Want the Facts Without Pausing the Program
You can think of a tracepoint as “a breakpoint that doesn’t interrupt execution.” When it hits, it prints to the Output window instead of stopping the program the way a regular breakpoint would.
It’s a great fit for:
- A problem that lives on a hot path, where a regular breakpoint would badly disrupt the flow.
- You need to log how several variables change over time rather than stopping at every point.
- You don’t want to touch the code to add logging, but you want log-like output anyway.
The first instinct most people have in this situation is to edit the code and add a log line. The value of tracepoints is that they give you temporary observability without touching your business code at all.
7. Data Breakpoints: When What You Care About Is “Who Changed This Value”
This is a seriously powerful category. A regular breakpoint answers “where did execution get to”; a data breakpoint answers “who actually changed this value.”
Typical cases:
- A property gets changed for no obvious reason.
- An object’s state gets corrupted at some point, and you don’t know where the write happened.
- A value gets shared and modified from many places across a tangle of call chains.
That said, it’s not available unconditionally. Some managed data breakpoints depend on a particular .NET version and object shape, and native environments are limited by the number of hardware breakpoints available. In other words, it’s very powerful, but check first whether your project type and runtime actually support it.
8. Dependent Breakpoints: Only Armed Once a Precondition Holds
Dependent breakpoints suit pinpointing a complex path. Say a shared utility function is called from all over the project, and you only care about the one time it’s called from a specific business path. Breakpointing the utility function directly would bury you in irrelevant hits, but a dependent breakpoint lets you hit an upstream breakpoint first and then conditionally arm the downstream one.
At bottom, it’s a way of expressing, at the debugger level, “this point is only worth watching once another condition has already held.”
4. Stepping: Not About Going Slow, But About Confirming Cause and Effect
A lot of beginners treat single-step debugging as “manually playing the program in slow motion.” That’s not entirely wrong, but it’s shallow. The real value of stepping is confirming the causal relationship between execution order and state changes.
1. Step Into: You Suspect the Problem Is Inside the Called Method
When a line calls a method and you suspect the real error happens once you’re inside, Step Into is the right call. It drops you inside the method body so you can keep watching a finer-grained execution path.
Where it applies:
- You don’t trust the internal logic of the called method.
- You suspect the input arguments are fine, but the method breaks state internally.
- You need to trace an execution chain through several layers of wrapping.
2. Step Over: You Know This Line Runs, You Just Don’t Care About the Internals Right Now
A lot of the time, you don’t need to dig into every single method — you need to get to the part that actually matters. That’s where Step Over is more efficient.
A mature debugging habit isn’t “step into every call” — it’s knowing which spots are worth digging into and which ones to skip for now. Otherwise you’ll burn a huge amount of attention on irrelevant detail.
3. Step Out: You’ve Seen Enough of the Current Method
If you’ve already stepped into a method and concluded the problem isn’t there, there’s no need to keep walking through it line by line. Step Out runs straight to the point where the current method returns and drops you back at the caller.
The point of this kind of move is saving cognitive load. Debugging efficiency isn’t just about knowing the tools — it’s about being willing to bail out of a dead-end path promptly.
4. Run to Cursor and Run to Click: Temporary Breakpoints That Are More Flexible Than Permanent Ones
Sometimes you just want to run quickly to a line somewhere in the visible area, without actually setting a breakpoint that sticks around. Run to Cursor and Run to Click are well suited to that kind of temporary navigation.
Typical cases:
- You’ve already confirmed the preceding logic is fine and want to jump straight to a later section.
- You temporarily need to skip over some repetitive path.
- You want to observe a one-off bit of behavior past your current position without cluttering up your breakpoint list.
5. Watching Variables Is Just the Start — What Matters More Is Seeing the Context a Variable Holds In
When debugging, a lot of people just stare at whether one variable’s value is right, but in reality a single value’s meaning usually depends on context. The core point of Visual Studio’s variable-watching tools isn’t “showing you a value” — it’s letting you put that value back into the runtime environment and make sense of it there.
1. Data Tips: The Fastest Local Check
While paused at a breakpoint, hover your mouse over a variable and you’ll see its current value. It’s the lightest-weight way to look, good for answering small local questions:
- Is this argument actually `null` right here?
- How many elements does this collection have right now?
- What’s this object’s key property right now?
If you just want to confirm one or two values quickly, Data Tips is usually more direct than switching windows.
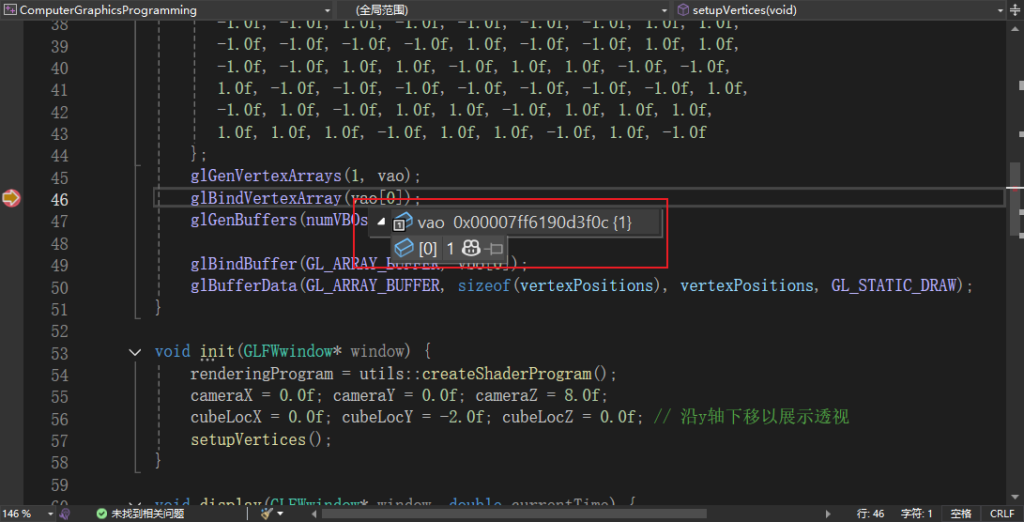
2. Autos and Locals: A Snapshot of the Current Scope
These two windows are great for a quick scan of the current scene.
- Autos leans toward variables related to the current statement.
- Locals leans toward the full set of variables visible in the current scope.
Their value is letting you start from local variables and quickly build an overall picture of what state the runtime is in at this step, rather than staring at just one expression.
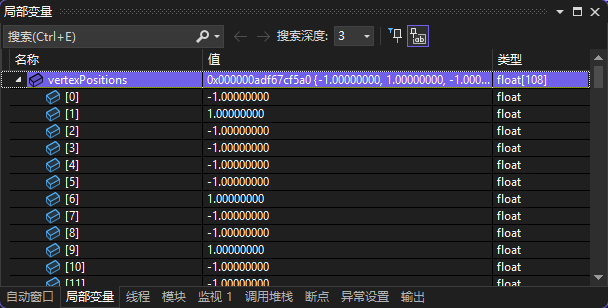
3. Watch: Keep an Eye on the Variables That Actually Matter, for the Long Haul
When the problem you’re tracking spans multiple steps, methods, and breakpoints, Watch is far steadier than hovering over values again and again. It’s good for:
- Tracking how a key variable or expression changes.
- Comparing the same expression’s state before and after a fix.
- Keeping a long-running eye on a collection’s size, a flag, or an object property.
The more disciplined approach isn’t dumping every variable into Watch — it’s adding only the expressions that actually test your current hypothesis. Otherwise Watch turns into a source of noise too.
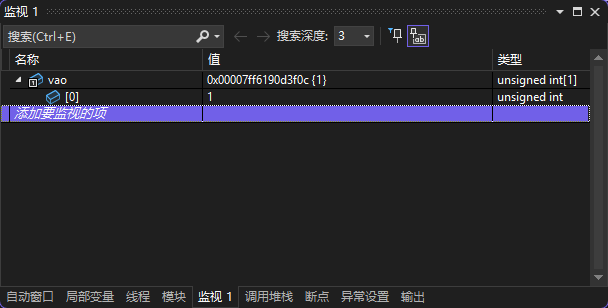
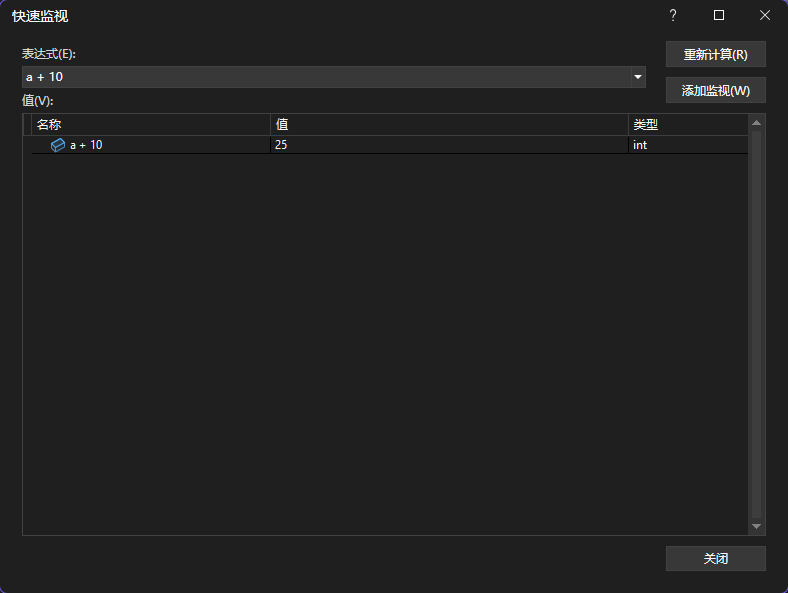
4. QuickWatch and Immediate Evaluation: Testing a Small Hypothesis
Sometimes you don’t just want to see a value — you want to evaluate an expression on the spot, expand an object, or check whether some condition holds. QuickWatch and the Immediate Window are made for this kind of look-and-verify-as-you-go work.
For example:
- Checking how many results a filter on a collection produces.
- Spot-checking the result of some string processing.
- Confirming exactly why a boolean condition isn’t being met.
Their point isn’t replacing code — it’s running a lightweight experiment without touching your business logic.
6. The Call Stack: A Lot of Bugs Aren’t in the Current Line — They’re in How You Got There
If I had to draw a line between developers who only know how to look at variables and developers who know how to read a call stack, I’d say the latter are usually closer to actually knowing how to debug.
That’s because a lot of problems aren’t “this line is wrong” — they’re “this line got executed on the wrong call path.”
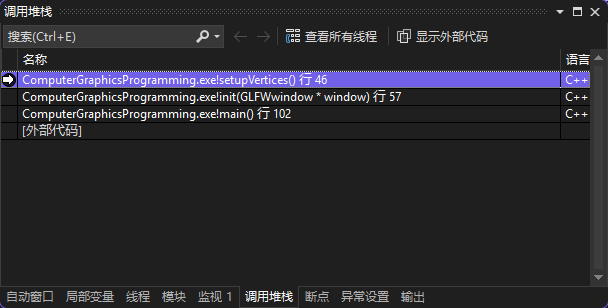
1. The Call Stack Answers “Why Did You End Up Here”
When the program stops on a line, the Call Stack tells you:
- Who called the current function.
- Who called that caller, one level up.
- How the whole call chain worked its way into the current context, layer by layer.
That’s critical in situations like:
- A shared method is called from multiple entry points, and you need to know which path this particular call came from.
- A parameter value is wrong, but the current method is just a passive recipient.
- An exception surfaces here, but the root cause may lie further upstream.
2. The Top of the Stack Isn’t the Root Cause
This is a very common trap. The line where an exception stops is often just where the symptom first surfaced, not necessarily where the corruption first happened.
For example:
- Hitting a null reference here doesn’t mean the `null` originated here.
- An out-of-bounds error here doesn’t mean the collection was built incorrectly here.
- A conversion failing here doesn’t mean the raw data got dirty here.
So the point of reading the call stack is turning your current breakpoint from an isolated dot into an execution path with a traceable history.
7. Exception Debugging: Don’t Just Read the Error Message — See Why the Exception Showed Up Here
For a lot of .NET developers, the Visual Studio Exception Helper is something they reach for constantly, but many people treat it as little more than an error popup. In fact, it gives you a clearer view of the exception’s type, message, context, and break policy.
1. First, Tell the Throw Site Apart from the Final Bubble-Up Point
An exception can get thrown deep down and only become visible to you much higher up. When debugging, figure out first whether where you’ve stopped is the original scene or the result of propagating through several layers already.
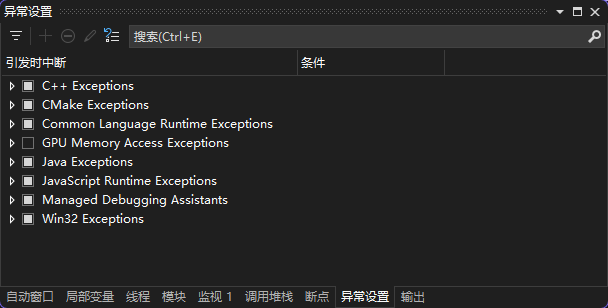
2. Configuring Exception Settings Matters
A lot of problems take a long time to pin down because developers only see the exception once the program finally crashes. In reality, Visual Studio lets you configure certain exceptions to break the moment they’re thrown, instead of waiting for them to get swallowed, wrapped, and rethrown along the way, until you’re left with a murky outer error.
This kind of setting is especially useful for:
- Business code that catches exceptions frequently but still ends up behaving oddly.
- Exceptions the framework wraps, where the original information isn’t easy to read directly.
- Cases where you need to observe context as close to the exception’s source as possible.
3. The Exception to the Rule: Not Every Exception Deserves “Break on Throw”
Some frameworks and runtime libraries use exceptions heavily for internal control flow. If you set every exception to break on throw, you’ll likely get buried in meaningless noise. So exception settings need to serve your current troubleshooting goal — more sensitivity isn’t automatically better.
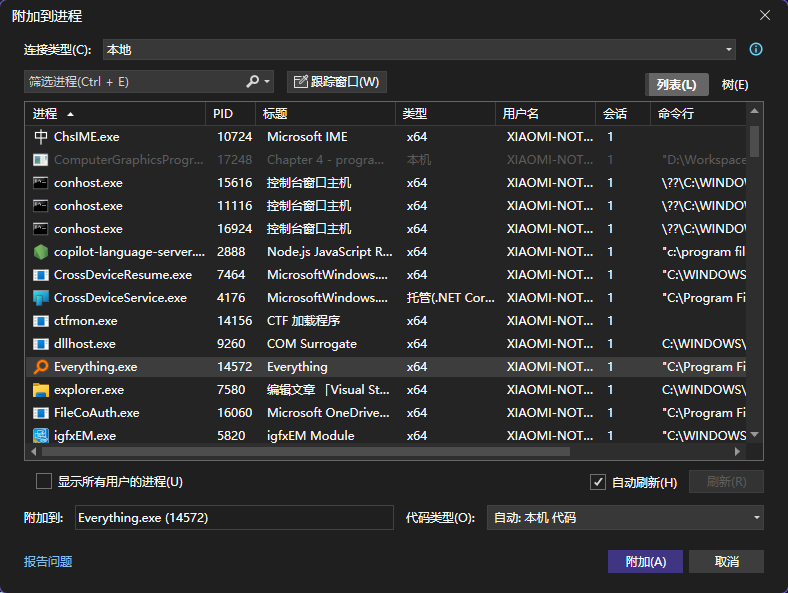
8. Attach to Process: Not Every Problem Can Start with “Launch It Yourself”
A lot of tutorials assume you’re launching the app directly from the IDE with F5, but reality isn’t always that clean.
Some problems show up in:
- A desktop application that’s already running
- A process hosted by IIS or a background service
- A toolchain, child process, or host process launched externally
- A target environment outside your own machine
That’s when you need Attach to Process.
1. When You Should Use Attach-to-Process Debugging
When a problem has nothing to do with launch timing and is tied instead to the process’s current state, the host environment, or genuine interaction, attaching gets you closer to the real scene than starting from scratch.
For example:
- A memory or state problem that only appears after running for a while.
- A problem triggered by an external system that you can’t easily reproduce with a local launch.
- A program that has to run inside a real host, where starting it standalone wouldn’t mean anything.
2. The Most Common Pitfalls With Attach-to-Process Debugging
- Attaching to the wrong process.
- A mismatch between the code version and the symbol files.
- Picking the wrong debugger type, so breakpoints don’t hit or variables display incorrectly.
- Insufficient permissions to attach at all.
If you notice a breakpoint shows up hollow, never hits, or your variable information is oddly missing, don’t rush to blame your code — check the process, the symbols, and the debugger type first.
9. Remote Debugging: When a Problem Only Shows Up Outside Your Own Machine
A lot of problems aren’t fundamentally about complex logic — they’re environment-related. For example:
- It only shows up on a test machine or a server.
- It only shows up under a particular permission level, network, or dependency version.
- It won’t reproduce reliably locally, but it reproduces reliably on the remote environment.
If you insist on “reproducing it on my machine first” for these kinds of problems, you’ll usually just get stuck. The point of remote debugging is bringing the debugger to an environment closer to where the real problem lives.
Of course, remote debugging usually comes with a higher bar to clear:
- Deploying the remote debugger and configuring the connection
- Network and permission restrictions
- Keeping the target machine’s code and symbols consistent with your local copy
- Controlling the impact on a production environment
It’s not your go-to tool on an average day, but for problems rooted in environment differences, it’s critical.
10. Threads, Tasks, and Concurrency Problems: Watching One Execution Flow Often Hides the Truth
If your program involves async work, task scheduling, background threads, or concurrent access, a lot of “occasional bugs” simply can’t be understood from a single-thread point of view.
In these scenarios, Visual Studio’s key value isn’t just pausing the program — it’s helping you identify the relationships between different execution flows.
1. When to Switch to the Thread or Task View
When you see these signs, lean on the Threads and Tasks windows more:
- The problem is intermittent and hard to reproduce reliably.
- The same logic behaves inconsistently on different threads.
- The UI freezes, a background task never returns, or a wait chain misbehaves.
- Shared state occasionally gets corrupted.
2. A Debugging Approach for Common Concurrency Problems
For these problems, don’t start by staring at one line — answer these first:
- Which thread is the current breakpoint on?
- What other threads are running or waiting at the same time?
- Did the current thread corrupt this variable, or did some other execution flow do it?
- Does the wait relationship shown in the call stack actually make sense?
In other words, the issue with concurrency bugs isn’t that breakpoints are hard to set — it’s that a plain breakpoint usually isn’t enough on its own.
11. Hot Reload and Edit and Continue: Faster Verification, Not a Magic Fix
Visual Studio lets you modify some code mid-debug session and keep running, which does a lot to shorten the verification loop. In programs with a costly startup, heavy UI interaction, or expensive state to reproduce, Hot Reload or Edit and Continue can noticeably boost your efficiency.
Where it fits:
- Small, localized logic fixes
- Text, display, or simple branch tweaks
- Quickly checking whether an idea works
But it’s not meant to be misused as “change it and gamble.” Editing code mid-debug is only for verifying a hypothesis faster, not for skipping a rigorous fix process. A fix that’s actually going to ship still needs to go back through the normal development, build, and test pipeline for confirmation.
12. Diagnostic Tools and Performance Analysis: Not Every Bug Throws an Error
A lot of people equate debugging with “find the exception, check variables, fix the logic.” But in reality, a sizable share of problems never show up as an error at all — they show up as:
- The program getting slower and slower
- Memory climbing steadily
- Some operation stuttering badly
- The UI freezing with no obvious exception
Interactive breakpoint debugging alone usually isn’t enough for these, because what you’re after isn’t whether one line ran — it’s resource usage and hotspots across a stretch of time.
1. When to Switch from Breakpoint Debugging to Performance Diagnostics
If your question is:
- “Why is this slow?”
- “Why isn’t memory getting released?”
- “Why does this page get laggier every time it opens?”
then you should reach for Diagnostic Tools, CPU usage analysis, memory analysis, and similar tools early, instead of still setting breakpoints and reading variables.
2. A Common Misconception About Performance Problems
A lot of developers read “the program didn’t crash” as “the logic is basically fine.” But performance regressions, resource leaks, frequent GC, and blocking waits are, at bottom, the same thing as runtime behavior drifting from expectations. They just don’t surface as an exception — they surface as time and resources.
13. Enterprise or Scenario-Specific Capabilities: Powerful, But Don’t Treat Them as Default
Visual Studio also has some powerful advanced capabilities — things like snapshot debugging, historical state playback, and certain enterprise-grade production diagnostic tools. They’re hugely valuable in the right scenario, especially for production problems that are hard to reproduce, but you need to be clear about the preconditions before you reach for them:
- Some capabilities depend on Visual Studio Enterprise.
- Some capabilities depend on a particular deployment environment, such as Azure scenarios.
- Some capabilities depend on the project type, runtime, or extra configuration.
The easiest way to mislead readers when writing about debugging is lumping these features in with everyday basic capabilities, as if everyone has them by default. The safer approach is filing them under “advanced and scenario-specific tools” and spelling out exactly where they apply.
14. Stringing These Tools Together: A Troubleshooting Path That Looks More Like an Engineering Practice
If you only memorize the features above as a scattered list, they’ll still feel messy in practice. The more effective way is putting them into a single main troubleshooting thread.
Here’s a sequence that’s closer to how real projects actually use them.
Step One: Get a Stable Repro First, Don’t Dive In Blind
Confirm what configuration, input, and operational path the problem happens under. Calibrate these first if you need to:
- The startup project
- Arguments and environment variables
- Debug/Release configuration
- Data sources and external dependencies
- The operational path
If you can’t even reproduce the problem reliably, everything after that easily turns into random trial and error.
Step Two: Use the Cheapest Observation Tools First to Narrow the Scope
Start by confirming the most basic questions:
- Did the code reach here at all?
- Was this branch entered?
- Is this really where the exception was first thrown?
At this stage, plain breakpoints, exception settings, the call stack, and a handful of Data Tips are usually enough. The goal isn’t finding the root cause right away — it’s narrowing the scope fast.
Step Three: Once the Scope Narrows, Upgrade Your Precision
If the problem only occurs with a particular value, object, iteration, or thread, stop grinding away with plain breakpoints and switch to:
- Conditional breakpoints
- Hit Count
- Filters
- Watch
- Tracepoints
- Data breakpoints
This is where the efficiency gap between developers really opens up. Whether you know how to debug often comes down to whether you know when to switch from coarse observation to precise observation.
Step Four: Confirm Whether Where You’ve Stopped Is the Root Cause
You absolutely have to read the call stack at this step. A lot of failed fixes happen because the developer worked at “the first place the exception showed up” without tracing back to “the first place the state actually went wrong.”
If the current point looks more like a symptom than a source, keep following the call stack upward, and reposition your breakpoints if you need to.
Step Five: If the Problem Involves the Environment, Host, or Runtime Process, Change How You Debug
Don’t insist on always starting from a local F5. As soon as the problem lives closer to a real process or a remote environment, consider:
- Attach to Process
- Remote debugging
- A launch method that’s closer to the real configuration
Step Six: If the Problem Shows Up as Slow, Laggy, or Growing Rather Than Wrong, Stop Fixating on Logic Breakpoints
At this point, swap tools, not guesses. Pulling up Diagnostic Tools, CPU analysis, or memory analysis is usually more effective than adding ten more breakpoints.
15. Common Inefficient Debugging Habits
No matter how powerful the tools are, using them the wrong way still leads to inefficiency. The following problems are extremely common.
1. Setting a Lot of Breakpoints Without a Clear Hypothesis
If you’re just “stopping here, stopping there” without a judgment you’re actually testing, debugging turns into low-quality wandering. Breakpoints aren’t decoration — they should serve a specific question.
2. Only Looking at the Current Variable, Never the Call Stack
This leaves you forever dealing with symptoms, and it’s especially easy to misjudge the root cause on null-reference, out-of-bounds, and state-corruption problems.
3. Editing Code to Add Logging Right Off the Bat
Logging matters, of course, but not every problem is worth editing code for first. For a lot of localized problems, observing first with breakpoints, Watch, Tracepoints, or the Immediate Window is cheaper and faster.
4. Debugging Diligently in the Wrong Environment
If something’s broken in production and you spend hours staring at your local default configuration, you may end up with a conclusion that’s simply irrelevant. If the environment is wrong, the harder you debug, the further off you can drift.
5. Not Re-Verifying the Full Path After a Fix
Fixing a symptom isn’t the same as solving the root cause. Truly finishing a debugging pass means confirming at least three things:
- The original problem is gone.
- The root cause that triggered it has been addressed.
- The fix didn’t introduce a new side effect.
16. A Practical Recommendation for Developers at Different Stages
If you’re a beginner, get comfortable with the following first:
- Plain breakpoints
- Conditional breakpoints
- Step Into / Step Over / Step Out
- Data Tips
- Locals / Watch
- Call Stack
- Exception break settings
These few are already enough to solve a large share of everyday problems.
If you already have some experience, the next things worth filling in are:
- Tracepoints
- Data breakpoints
- Attach to Process
- Remote debugging
- The thread and task view
- Diagnostic Tools and performance analysis
Because what really sends debugging difficulty through the roof usually isn’t basic syntax errors — it’s complex context, real environments, and system-behavior problems.
Closing Thoughts: The Value of the Visual Studio Debugger Isn’t “Having a Lot of Features” — It’s Helping You Shrink Uncertainty
Writing this out to the end, you notice that the Visual Studio debugger isn’t a scattered pile of buttons — it’s a complete toolset for how you gather evidence at runtime. Breakpoints control when you observe, stepping confirms execution order, the variable windows make sense of current state, the call stack reconstructs how you got there, the Exception Helper gets you close to the scene of the failure, attaching and remote debugging bring you closer to the real environment, and the performance tools remind you that not every bug shows up as red text.
What really matters isn’t whether you can open every one of these windows — it’s whether, faced with a problem, you know what to look at next, why you’re looking at it, and how to narrow the scope once you’ve looked. Tools are just the means; debugging efficiency still comes down to whether you can turn a messy symptom into a clear cause.
If you think of debugging as the process of restoring a system’s explainability, then what Visual Studio offers here is exactly where that process lands most directly. Knowing how to use them isn’t just about fixing a bug faster — it’s about moving yourself from guessing by experience to judging by evidence.